|
Artículo Científico / Scientific Paper |
|
|
|
|
https://doi.org/10.17163/ings.n29.2023.10 |
|
|
|
pISSN: 1390-650X / eISSN: 1390-860X |
|
|
SENTIMENTAL ANALYSIS OF COVID-19 TWITTER DATA USING
DEEP LEARNING AND MACHINE LEARNING MODELS |
||
|
ANÁLISIS SENTIMENTAL DE LOS DATOS DE TWITTER DE COVID-19 UTILIZANDO MODELOS DE APRENDIZAJE PROFUNDO Y APRENDIZAJE MÁQUINA |
||
|
Received: 15-10-2021, Received after review:
01-12-2022, Accepted: 16-12-2022, Published: 01-01-2023 |
|
Abstract |
Resumen |
|
The novel
coronavirus disease (COVID-19) is an ongoing pandemic with large global attention.
However, spreading fake news on social media sites like Twitter is creating
unnecessary anxiety and panic among people towards this disease. In this
paper, we applied machine learning (ML) techniques to predict the sentiment
of the people using social media such as Twitter during the COVID-19 peak in
April 2021. The data contains tweets collected on the dates between 16 April
2021 and 26 April 2021 where the text of the tweets has
been labelled by training the models with an already labelled dataset
of corona virus tweets as positive, negative, and neutral. Sentiment analysis
was conducted by a deep learning model known as Bidirectional Encoder
Representations from Transformers (BERT) and various ML models for text
analysis and performance which were then compared
among each other. ML models used were Naïve Bayes, Logistic Regression,
Random Foest, Support Vector Machines, Stochastic
Gradient Descent and Extreme Gradient Boosting. Accuracy for every sentiment
was separately calculated. The classification accuracies of all the ML models
produced were 66.4%, 77.7%, 74.5%, 74.7%, 78.6%, and 75.5%, respectively and
BERT model produced 84.2%. Each sentiment-classified model has accuracy
around or above 75%, which is a quite significant value in text mining
algorithms. We could infer that most people tweeting are taking positive and
neutral approaches. |
En este artículo, aplicamos técnicas de aprendizaje automático para predecir el sentimiento de las personas que usan las redes sociales como Twitter durante el pico de COVID-19 en abril de 2021. Los datos contienen tweets recopilados en las fechas entre el 16 de abril de 2021 y el 26 de abril de 2021, donde el texto de los tweets se ha etiquetado mediante la formación de los modelos con un conjunto de datos ya etiquetado de tweets de virus de corona como positivo, negativo y neutro. El análisis del sentimiento se llevó a cabo mediante un modelo de aprendizaje profundo conocido como Representaciones de Codificadores Bidireccionales de Transformers (BERT) y varios modelos de aprendizaje automático para el análisis de texto y el rendimiento, que luego se compararon entre sí. Los modelos ML utilizados son Bayes ingenuas, regresión logística, bosque aleatorio, máquinas vectoriales de soporte, descenso de gradiente estocástico y aumento de gradiente extremo. La precisión de cada sentimiento se calculó por separado. La precisión de clasificación de todos los modelos de ML producidos fue de 66.4%, 77.7%, 74.5%, 74.7%, 78.6% y 75.5%, respectivamente y el modelo BERT produjo 84.2%. Cada modelo clasificado de sentimiento tiene una precisión de alrededor o superior al 75%, que es un valor bastante significativo en los algoritmos de minería de texto. Vemos que la mayoría de las personas que tuitean están adoptando un enfoque positivo y neutral. |
|
Keywords: COVID-19, coronavirus, Twitter, tweets,
sentiment analysis, tweepy, text classification |
Palabras clave: COVID-19, coronavirus, Twitter, tweets, análisis de los sentimientos, ttweepy, clasificación de texto |
|
1,*Data
Science and Analytics, Toronto Metropolitan University, Canada. Corresponding
author ✉: sdarad@ryerson.ca. 2Department
of Electrical, Computer, and Biomedical Engineering, Toronto Metropolitan
University, Canada. Suggested citation: Darad,
S. and Krishnan, S. “Sentimental analysis of COVID-19 twitter data using deep
learning and machine learning models,” Ingenius, Revista de Ciencia y Tecnología, N.◦ 29, pp. 108-117, 2023, DOI:
https://doi.org/ 10.17163/ings.n29.2023.10. |
|
1.
Introduction There are various
kinds of social media platforms that are used by
users for many reasons. In recent times, the most used social media platforms
for informal communications have been Facebook, Twitter, Reddit,
etc. Amongst these, Twitter, the microblogging platform, has a
well-documented Application Programming Interface (API) for accessing the
data (tweets) available on its platform. Therefore, it has become a primary
source of information for researchers working on the Social Computing domain
[1]. Social Media platforms such as Twitter are a great resource to capture
human emotions and thoughts. During these trying times, people have taken to
social media to discuss their fears, opinions, and insights on the global
pandemic [2]. For this research, we focused on a dataset that belonged to the
Twitter tweets and accessed tweets related to “COVID-19 Pandemic”. Coronavirus
disease 2019 (COVID-19) was first detected in Wuhan, China, in December 2019
and has spread worldwide in more than 198 countries [3]. The outbreak of
COVID-19 has a socio-economic impact. The World Health Organization declared
it an epidemic on 30 January 2020. Since then, it has spread exponentially,
inflicting serious health issues including painful deaths [4]. Large-scale
datasets are required to train machine learning
models or perform any kind of analysis. The knowledge extracted from small
datasets and region-specific datasets cannot be generalized
because of limitations in the number of tweets and geographical coverage.
Therefore, this paper introduces a large-scale COVID-19-specific English
language tweets dataset [5]. The
main objective of this work is to predict people’s sentiments during the peak
of the pandemic in April 2021. How can we classify coronavirus tweets as
positive, negative, and neutral; which tells us
about how people are feeling? So, there are two ways
to label the tweets that were extracted using the Twitter API with tweepy. The first way is training already labelled data
with BERT and various machine learning models, evaluating which model
classifier could correctly label the tweets and then using it to label the
text of the tweets extracted. The second way is to find the sentiment comes
by using an open-source sentiment analyzer pre-built library known as VADER.
It automatically predicts the sentiment score of the tweets classifying the
tweets with the power of machine learning and using it to make inferences
about the extracted tweets. Based on the classification of different tweets,
the effort was to be able to provide more insights about the pandemic
affecting mental health and people’s reaction about how well they are
handling this situation. |
1.1.
Literature
Review The main aim of this work is to analyze
people’s reactions on the global pandemic COVID-19 via tweets and classify
them as positive, negative, or neutral. This is done
by performing sentiment analysis on the data obtained from Twitter. Several
Machine Learning techniques have been used to obtain
the results. In this section, we will provide an overview of the papers used
as references for this work. There have been many studies on
this in a short span of time. To begin with, the trends of positive,
negative, and neutral tweets state-wise and monthwise in India are captured and presented in this
paper. Firstly, state-wise analysis is done and then
the frequency of Positive, Negative, and Neutral tweets are calculated. From
the analysis in this paper, it is observed that
people in India were mostly expressing their thoughts with positive
sentiments [1]. In another paper, a very large dataset of almost over 310
million tweets is taken into consideration. This
study specifies the sentiment scores of the tweets in English language only. And it was observed that a common hashtag was being used
in most of the tweets [5]. In another research work, country-wise
sentiment analysis of the tweets has been done. This research work has taken
into account the tweets from twelve countries gathered from 11th March 2020
to 31st March 2020. The tweets have been collected, pre-processed, and then
used for text mining and sentiment analysis. The result of the study concludes
that while the majority of the people throughout the world took a positive
and hopeful approach, there are instances of fear, sadness and disgust
exhibited worldwide [6]. Another research paper in which the BERT model was used to analyze the sentiments behind tweets made by
netizens of India. There were several common words that
came out in the analysis and based on that the tweets are classified into
four sentiments such as fear, sad, anger, and joy. This model was 89%
accurate as compared to other models like LR, SVM, LSTM
[7]. A short research aimed at analyzing the sentiments and emotions of
people during COVID-19 was conducted based on the tweets from March 11th to
March 31st, 2020, which gave us the results that the mindsets of people was
almost at the same level all around the world [8]. There have been few papers in
which the exploratory analysis of the data is performed
to obtain the results. For instance, in a research paper, exploratory data
analysis was performed for a dataset providing information about the number
of confirmed cases on a per-day basis in a few of the worst-hit countries to
provide a comparison between the change in sentiment with the change in cases
since the start of this pandemic till June 2020 [2]. In this paper, the
authors have tried to understand and analyze the tweets around COVID-19 in
India and have tried to analyze |
|
these data using NVIVO processors and
word cloud. The study involves the words, hashtag being
used and the sentiments involved around these words. The conclusion
gives an understanding of high-impact and low-impact words [9]. In this
research paper, data is collected from the users who
shared their location as ‘Nepal’ between 21st May 2020 and 31st May 2020. The
result of the study concluded that while majority of the people of Nepal took
a positive and hopeful approach, there are instances of fear, sadness and
disgust exhibited too [10]. Since Twitter is a
place where individuals can express their views without revealing their
identity, this is used as an advantage by many of them to
present their opinions either positive negativelyive
based on their sentiments. By using various Machine Learning
techniques and knowledge from social media, sentiment analysis on COVID
Twitter data was performed, which gave us the
results as positive or negative. Logistic Regression Algorithm was used to
perform the analysis which gave an accuracy up to
78.5% [11]. Data mining was
conducted on Twitter to collect a total of 107,990
tweets related to COVID-19 between December 13, 2019, and March 9, 2020. A
Natural Language Processing (NLP) approach and the latent Dirichlet
allocation algorithm were used to identify the most
common tweet topics as well as to categorize clusters and identify themes
based on the keyword analysis. The results indicate the main aspects of
public awareness and concern regarding the COVID-19 pandemic. First, the
trend of the spread and symptoms of COVID-19 can be divided
into three stages. Second, the results of the sentiment analysis showed that
people have a negative outlook toward COVID-19 [12]. In this paper, our aim
is to perform a sentimental analysis of tweets during the COVID-19 pandemic
and classify them as positive, negative, or neutral. After learning about
the dataset, the next step was to solve the classification problem. The
classification problem in this paper is sentiment analysis. Many of the
papers already mentioned earlier [1, 5] performed sentiment analysis on
tweets to classify them in three different categories. These research papers
provided vital information about how sentiment analysis can
be performed for the classification of tweets in the dataset. Creating
a classifier was the next step. “The impact of preprocessing on text
classification” is a resourceful paper that provided details and leads on how
to conduct preprocessing on data and which classifier would be optimal. It
mentions that SVM is state-of-the-art pattern classifier and is recommended to be used as the classification algorithm
[13]. The papers use Random Forest, Naïve Bayes, SVM, and Random Forest for
classification and tells us that Linear SVM provided the best results. Almost
95% accuracy was achieved using this technique.
Based on this research, we have decided to use Naïve Bayes, Logistic
Regression, Random Forest, SVM, SGD, XGB and BERT. |
Before moving
further to the dataset, it is important to know about the dataset and learn
as much about it as possible. A detailed exploratory analysis of the dataset was conducted using reference from various papers. 2. Materials and Methods 2.1. Material Data for this work is acquired from Twitter using its API and tweepy. Tweepy is an
open-source and easyto-use Python package for
accessing the functionalities provided by the Twitter API. Tweepy includes a set of classes and methods that
represent Twitter’s models and API endpoints, and it transparently handles
various implementation details, such as: Data
encoding and decoding. Data extraction of tweets from Twitter API is done
from date 16th April 2021 to 26th April 2021 containing 2,00,000 tweets to
get a bigger dataset and better results. The other dataset is
open-sourced and collected from a blog [14] which
contains coronavirus tweets with labelled sentiments. The dataset that has been collected for tweets by the blog was a labelled
sentiment analysis dataset. This dataset was split
into two subsets for training and testing of the various classifiers. The
dataset we gathered and fetched from Twitter is unlabelled. 2.1.1. Descrptive Analytics The dataset contains text fields,
so text analysis of the tweets was performed as
outlined below. But before that analysis was
conducted to learn more about the dataset. Firstly, even before the cleaning
process, one should get familiar with the kind of data they’ll
be dealing with. This just helps in providing more context and background
information to the data scientist. So, after loading
the csv file, a few functions were run on the data just to familiarize with
it. We get to know the size of the data, the data types of each column, the
number of null entries, the distribution of different classes, etc. Next is
dropping duplicate rows if any. We then realize that we won’t be needing a few columns in further analysis, so we drop
it. After those
preprocessing techniques were applied to the data to
clean the tweets. It includes converting the text to lowercase, tokenization,
and removal of username tags, retweet symbol, hashtags, white spaces,
punctuations, numbers, emoji, and URLs to clean the text. Using this clean text,
further text analysis was conducted as outlined
below. The analysis was conducted on the dataset we
collected from Twitter API with 200,000 tweets (Figure 1). |
|
Figure 1. Dataset
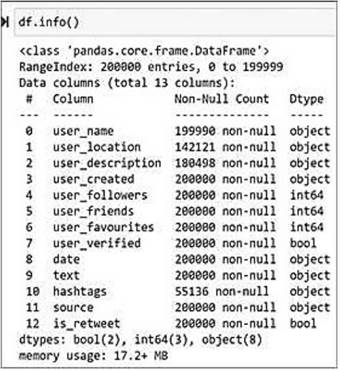
size We look at the
information of the dataset. It tells us about the type of field
it is and about how many non-null values are present in the dataset, which
helps us understand our dataset better (Figure 2).
Figure 2.
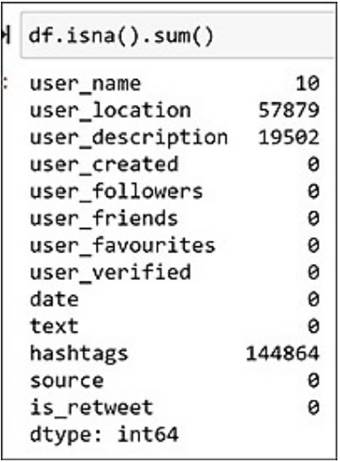
Dataset information With social media,
one can never retrieve all the data. There are always some missing values in
the dataset. People like to keep few things discreet such as their location
and description in case of twitter. Also, some
people as we can see are not comfortable of using hashtags see Figure 3.
Figure 3.
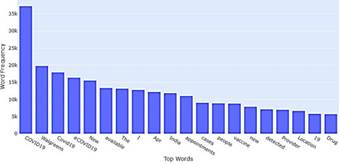
Total null values Then finding out
what is term frequency of the words showing the most frequently used words by
their |
count. We see that “COVID-19” is the
most used word (Figure 4).
Figure 4. Top words used in tweets To get a closer look
at the text contained in the dataset, a visualization of the word cloud was created (Figure 5).
Figure 5.
Word Cloud for top 50 most used words The word cloud above
lists all words with the top 50 most used words. Word clouds are useful in
understanding what the users are posting about. Most
of the words are related to COVID, and new cases, and
it seems like most people posted about vaccines as well (Figure 6). After looking at an
overview of the tweet text in our corpus, let’s move on to hashtags looking
for the most trending ones
Figure 6.
Word Cloud for Hashtags The word cloud above
lists all words with extremely used hashtags. Word clouds are useful in
understanding what the users are posting about. Most
of the words are related to COVID, new cases, and it
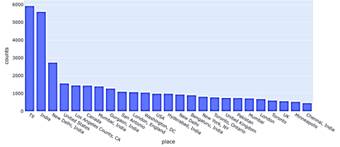
seems like most people posted about vaccines as well. Figure 7 shows the
location of the people from where most of them are tweeting. We can see a
large number of people are tweeting from India and USA, as the time period
selected for extracting the tweets |
|
was during the third wave and the
number of cases was higher in those countries.
Figure 7.
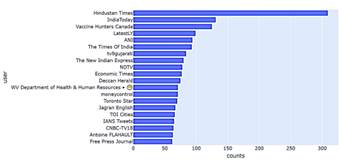
Top 25 locations where tweets originate from Figure 8 shows which verified users tweeted the most about COVID.
We can see that almost all of them are news channels tweeting about the
latest updates about COVID and the number of cases in their respective
countries.
Figure 8.
Top 20 user-verified tweets After looking at an
overview of the data, we clean and preprocess the text of the tweets in our
corpus, moving on to do some n-gram analysis. N-grams provide a better
context of what the users are posting about as we move to bi
and trigrams because these provide the most frequent phrases instead of just
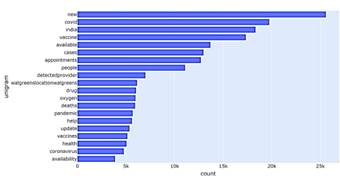
words. Figure 9 shows that most frequent unigrams are based
on new cases, vaccines, health, pandemic, people, availability and
appointments.
Figure 9.
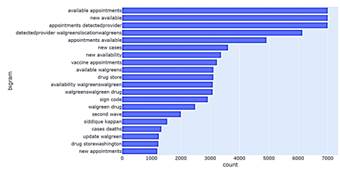
Top 20 Unigrams A bigram (Figure 10)
analysis provides further details trending during that time giving details
about availability of vaccine appointments, new cases and second wave. |
Figure 10.
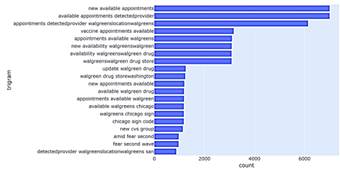
Top 20 Bigrams A trigram (Figure
11) analysis provides further details on where the COVID new vaccine
appointments are available. It seems like most of them are in Walgreens which is an American company that operates as
the second-largest pharmacy store chain in the United States behind CVS
Health.
Figure 11.
Top 20 Trigrams 2.2. Methods The aim of this study is to train
text from the labelled tweets that could automatically assess if the unlabelled tweet gathered is positive, negative, or
neutral. After training the models on labelled twitter data, models were applied to data extracted to label the sentiments and
compare the results of different algorithms. The second method of tweets
labelling is done by using NLTK VADER inbuilt python
package based on lexicons. In this work, the
response is labelling the tweets as positive, negative or neutral. The
dataset gathered contains a lot of information on the user such as name,
description, followers, friends and many more but only the text of the tweet was used to label the data from training the existing
labelled data. 2.2.1.
Experimental
Design 1 It is very difficult to label the
sentiments for COVID-19 data because of the words used to represent the
situation. For example, if there are new cases, there is a tweet saying “I am tested Corona positive” which ML technically
would label as positive. So, there is a huge
uncertainty in predicting the sentiments of the pandemic. Therefore, we apply
two different techniques to understand the sentiments. |
|
a)
Text
Processing The dataset called “coronavirustweets” contained labelled data of tweets
showing the sentiment as extremely positive, positive, neutral, negative and
extremely negative. Narrowing down the categorical labels to only three-class
classifications, there is neutral, negative combined with extremely negative,
and positive combined with extremely positive to achieve greater accuracy.
The text from the original tweet needs to be pre-processed
to train and test the data by removing punctuations, stop words, spaces,
emoticons and stemming the data. The
preprocessing of the text data is an essential step as it makes the raw text
ready for mining. The objective of this step is to clean text irrelevant to
search the sentiment of tweets such as punctuation(.,?,”etc.), special
characters (,%,&,$, etc.), numbers (1,2,3, etc.), Twitter handle,
links(HTTPS: / HTTP:) and stop words which don’t mean anything in context to
the text. Stop
words are those words in natural language that have very little meaning, such
as “is”, “an”, “the”, etc. To remove stop words from a sentence, the text can be divided into words and then remove the word if it
exists in the list of stop words provided by NLTK. b)
Randomization The dataset was randomly divided into two sets stratifying with
sentiment values of the dataset, one for training with 80% data and another
for testing with 20% data. c)
Vectorizing the tweets Before we implement
different ML text classifiers, we need to convert the text data into vectors.
It is crucial as the algorithms expect data in some mathematical for rather
than textual form. Count Vectorizer counts the
number of times a word appears in the document (in each tweet). This process
helps in converting the text data as we understand it, to numerical data, that is easier for the computer to understand. d)
Classifiers After vectorizing the tweets, we are all set to implement
classification algorithms. There are three types of sentiments so we must
train our models so that they can give us the correct label for the test
dataset. We have built different machine learning models such as Naive Bayes,
Logistic Regression, Random Forest, Support Vector Machine, Stochastic
Gradient Descent and Extreme Gradient Boosting along with BERT, a deep
learning model. Ensemble Classifier such as bagging and boosting are applied on the dataset as well to minimize any
over-fitting by the classifiers. |
We use the accuracy
score to measure the performance of the model (precision score, recall and
confusion matrix are also calculated). Precision
score, recall and confusion matrix let us know how correctly labelled the
actual values are. BERT(bi-directional Encoder
Representation of Transformers) is a technique developed by Google based on
the Transformers mechanism. In our sentiment analysis application, our model is trained on a pre-trained BERT model. BERT models have
replaced the conventional RNN based LSTM networks which suffered from
information loss in large sequential text [15]. The results from paper
explained that a language model that is bi-directionally prepared can have a more profound feeling of language setting and
stream than single directional models. In contrast to directional models that
enable sequential reading of text input (right to left or left to right), the transformer encoder recognizes the total sequence of
words at once. Thus, it is considered bidirectional,
but it is a non-directional model with higher accuracy than other established
models [7]. e)
Labelling
new tweets Since our collected data is not labelled, we save and load our trained models with
pickle. This allows us to save our model to a file and load it later in order
to make predictions. We can then apply them to label the data we extracted
and preprocessed. f)
Comparing
algorithms Obtaining the sentiments of the
tweets from different models and saving the csv files of different models, we
compare the results of the labelled data. 2.2.2.
Experimental
Design 2 VADER stands for Valence Aware
Dictionary and sentiment Reasoner. VADER belongs to
a type of sentiment analysis that is based on
lexicons of sentimentrelated words. It is a
rule-based model for general sentiment analysis, and its effectiveness was
compared to 11 typical benchmarks, including Word Count (LIWC), Affective
Norms for English Words (ANEW), the General Inquirer, Linguistic Inquiry, Senti WordNet, and machine learning techniques that rely
on Support Vector Machine (SVM) algorithms, Naive Bayes, and Maximum Entropy.
In this approach, each of the words in the lexicon is rated
as to whether it is positive or negative, and in many cases, how positive or
negative. VADER performs well
in the analysis of sentiments expressed in social media. These sentiments
must be present in the form of comments, tweets, retweets, or post
descriptions, and it works well on texts from other domains
also. We design our VADER sentiment model, which extracts features
from Twitter data, formulates |
|
the sentiment scores, and classifies
them into positive, negative, neutral classes. a)
Data
Cleaning The dataset
extracted from the tweet needs the text to be pre-processed
by removing punctuations, stop words, spaces, emoticons and stemming the
data. b)
Finding
Polarity The compound score
(polarity) is computed by summing the valence scores for each word in the
lexicon, adjusted according to the rules, and then normalized to be between
-1 (most extreme negative) and +1 (most extreme positive). c)
Finding
Sentiments After getting the
compound scores, the polarity of the tweets is used
to categorize them into 3 classes: Positive, Negative and Neutral. Positive
Sentiments are those with a score above 0. Negative sentiments from less than
0, and neutral sentiments are having 0.0 polarity. These 3 classes were
stored along with the tweets in the dataset called “Sentiments”. 3.
Results and discussion 3.1.
Results 3.1.1. Experimental Result 1 Multi-class
classification on different models was applied to
train data to find the accuracy of the correct label for the test dataset. I
have built different ML models like Naive Bayes, Logistic Regression, Random
Forest, Support Vector Machine, Stochastic Gradient Descent and Extreme
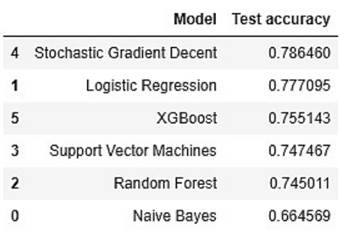
Gradient Boosting (Figure 12). We
have observed that the Stochastic Gradient Descent classifier gives the best
result with accuracy reaching 78.64%. The accuracy is pretty much close to
the accuracy of Logistic Regression, and both models can be
used to predict the sentiment of unlabelled
data. The least accuracy is shown by Naïve Bayes Classifier.
It works well with large data. Naïve Bayes works on n-grams, I have tried
using different n-grams, but accuracy stays around 65%. |
Figure 12.
Comparison of model accuracies The BERT model
performs extremely well in comparison to other ML models. It gives an
accuracy score of 84.2%, which is the highest accuracy we got by training and
testing the models. BERT is an excellent and different technique, which
provides the best accuracy because it is designed to
read in both directions at once. This capability, enabled by the introduction
of Transformers, is known as bi-directionality.
BERT, however, was pre-trained using only an unlabeled, plain text corpus
(namely the entirety of the English Wikipedia, and the Brown Corpus). It
continues to learn unsupervised from the unlabeled text and improve even as its being used in practical applications (ie Google search). Its pre-training serves as a base
layer of "knowledge" to build from. From
there, BERT can adapt to the evergrowing body of
searchable content and queries and be fine-tuned to
a user’s specifications. This process is known as
transfer learning [16]. Next using this
trained model on our dataset, we see the following results based on the test
accuracy (Figure 13).
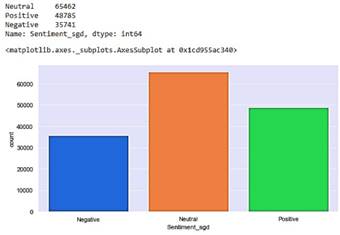
SGD Classifier gives: Neutral: 65462 Positive: 48785 Negative: 35741
Figure 13. SGD
Classifier results
Stochastic Gradient
Descent is a simple yet very efficient approach to fitting linear classifiers
and regressors under convex loss functions. SGD has
been successfully applied to large-scale and sparse machine |
|
learning problems often encountered in
text classification and natural language processing, which is why it performs
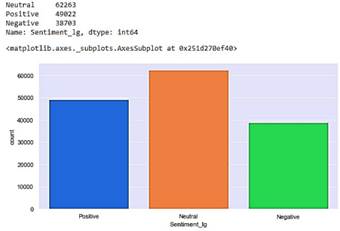
better than all other models (Figure 14). LG
Classifier gives: Neutral:
62263 Positive:
49022 Negative: 38703
Figure 14. LG Classifier results Seeing
the results, we observe Logistic Regression gives more Positive and Negative
labelled tweets whereas Stochastic Gradient Boosting predicts some of them as
Neutral. Even though the accuracy for these both is almost the same, there is
different labelling of approximately 3,000 tweets as neutral. Multinomial
logistic regression is an extension of logistic regression that adds native
support for multi-class classification problems. Logistic regression, by
default, is limited to two-class classification problems, which is why SGD is
better in accuracy for predicting sentiments. Ensemble
Classifier such as bagging and boosting are applied
on the dataset to minimize any over-fitting by the classifiers. But there isn’t any over-fitting of the data because the
accuracy obtained by bagging is 72.1% which is around the same whereas
accuracy of boosting is 51.4% which is pretty much lower. A
similar analysis has been presented in [17] for the understanding of pandemic
anxiety among Twitter users based on keywords. About 900,000 tweets were extracted from Twitter Application programming
interface (API) and analysed using Naïve Bayes and
logistic regression models. The model accuracy that appeared in short tweets
is 91% and 74%, respectively. However, the main limitation of this study is
all sentiments depend on the single word “fear” of only USA citizens and they
are short tweets [7]. 3.1.2. Experimental Result 2 VADER sentiment
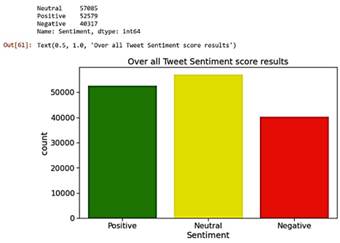
model is an automatic labelling technique in which we formulated the
sentiment score by classifying the tweets as positive, negative and neutral.
The main difference we observe here is, it gives |
fewer (around 5000 fewer) neutral
tweets and classifies them as positive and negative. We can see that it
almost matches our trained labelled models accuracy by showing us the results
as follows (Figure 15):
Figure 15. VADER results 3.2.
Discusssion This study can be
used to analyze the changing sentiments of people from all over the world and
check whether there are major shifts in them over the period
of time along with the increased supply of vaccinations. It is expected that as the spread of this pandemic will
increase for unvaccinated people, the sentiments in the tweets to positive
almost entirely as things get back to normal. A
similar analysis was conducted using TextBlob as we did in Experiment 2 but we used VADER. But according to the TextBlob
documentation, TextBlob takes advantage of Naïve
Bayes (NB) model for classification. NB classifier has been
trained on NLTK (Natural Language Tool Kit) to detect the valence of
aggregated tweets [10]. As we saw Naïve Bayes gives the least accuracy so Textblob is not accurate for labelling sentiments.
Classical ML methods provided an accuracy of high 70%, whereas the deep
learning model that uses BERT provided an impressive accuracy rate of 84.2%. 4. Conclusions The results of the
study conclude that majority of the people throughout the world took a
positive and hopeful approach. However, countries such as India and United
States of America have shown signs of biggerscale
tweeting due to the third wave as compared to remaining countries. We
used two techniques for our dataset to get the labels, but as we show, there
is always some margin of error in text classification. We also show that BERT
requires high computational power, GPU and a large time to train on a model.
The prediction of any social media text is nearly impossible to give a
perfect accuracy score. Through this, we can learn the main issue to help the
healthcare providers to identify some kind of mental illness before it’s too late. |
|
Acknowledgements The authors would
like to thank Ryerson University for supporting this project. References [1] T. Vijay, A.
Chawla, B. Dhanka, and P. Karmakar,
“Sentiment analysis on covid19 twitter data,” in 2020 5th IEEE International
Conference on Recent Advances and Innovations in Engineering (ICRAIE),
2020, pp. 1–7. [Online]. Available: https://doi.org/10.1109/ICRAIE51050.2020.9358301 [2] M. Mansoor, K. Gurumurthy, A. R. U, and V. R. B. Prasad, “Global sentiment analysis of COVID-19 tweets over time,” CoRR, vol. abs/2010.14234, 2020. [Online]. Available: https://doi.org/10.48550/arXiv.2010.14234 [3] H. Drias and Y. Drias, “Mining twitter data on covid-19 for sentiment analysis and frequent patterns discovery,” medRxiv, 2020. [Online]. Available: https://doi.org/10.1101/2020. 05.08.20090464 [4] F. Rustam, M. Khalid, W. Aslam, V. Rupapara, A. Mehmood, and G. S. Choi, “A performance comparison of supervised machine learning models for covid-19 tweets sentiment analysis,” PLOS ONE, vol. 16, no. 2, pp. 1–23, 02 2021. [Online]. Available: https://doi.org/10.1371/journal.pone.0245909 [5] R. Lamsal, “Design and analysis of a large-scale COVID-19 tweets dataset,” Applied Intelligence, vol. 51, no. 5, pp. 2790–2804, May 2021. [Online]. Available: https://doi.org/10.1007/s10489-020-02029-z [6] A. D. Dubey, “Twitter sentiment analysis during covid-19 outbreak,” SSRN, 2021. [Online]. Available: https://dx.doi.org/10.2139/ssrn.3572023 [7] N. Chintalapudi, G. Battineni, and
F. Amenta, “Sentimental analysis of COVID-19 tweets
using deep learning models,” Infect Dis Rep, vol. 13, no. 2, pp.
329–339, Apr. 2021. [Online]. Available: https://doi.org/10.3390/idr13020032 |
[8] M. A. Kausar, A. Soosaimanickam, and
M. Nasar, “Public sentiment analysis on twitter
data during covid-19 outbreak,” International Journal of Advanced Computer
Science and Applications, vol. 12, no. 2, 2021. [Online]. Available:
http: //dx.doi.org/10.14569/IJACSA.2021.0120252 [9] A. Mitra and S. Bose, “Decoding Twitter-verse: An analytical
sentiment analysis on Twitter on COVID-19 in india,”
Impact of Covid 19 on Media and Entertainment,
2020. [Online]. Available: https://bit.ly/3YMj1c3 [10] B. P. Pokharel, “Twitter sentiment analysis during covid-19
outbreak in nepal,” SSRN, 2020. [Online].
Available: https: //dx.doi.org/10.2139/ssrn.3624719 [11] C. R. Machuca, C. Gallardo, and R. M. Toasa,
“Twitter sentiment analysis on coronavirus: Machine learning approach,” Journal
of Physics: Conference Series, vol. 1828, no. 1, p. 012104, feb 2021. [Online]. Available: https:
//dx.doi.org/10.1088/1742-6596/1828/1/012104 [12] S. Boon-Itt and Y. Skunkan, “Public
perception of the COVID-19 pandemic on twitter: Sentiment analysis and topic
modeling study,” JMIR Public Health Surveill,
vol. 6, no. 4, p. e21978, Nov. 2020. [Online]. Available: https://doi.org/10.2196/21978 [13] A. K. Uysal and S. Gunal, “The impact
of preprocessing on text classification,” Information Processing &
Management, vol. 50, no. 1, pp. 104–112, 2014. [Online]. Available: https://doi.org/10.1016/j.ipm.2013.08.006 [14] S. Gujral, “Sentiment analysis: Predicting sentiment of
COVID-19 tweets,” Analytics Vidhya, 2021.
[Online]. Available: https://bit.ly/3j9tMVj [15] ——, “Amazon
product review sentiment analysis using bert,” Analytics
Vidhya, 2021. [Online]. Available: https://bit.ly/3Vad9WE [16] B. Lutkevich. (2022) Bert language model. TechTarget Enterprise Al. [Online]. Available: https://bit.ly/3Wo5Pb4 [17] J. Samuel, G. G. M. N. Ali, M. M. Rahman, E. Esawi, and Y. Samuel, “Covid-19 public sentiment insights and machine learning for tweets classification,” Information, vol. 11, no. 6, 2020. [Online]. Available: https://doi.org/10.3390/info11060314
|
